Quick Navigation
Calling Weather API in ServiceNow
Let’s be honest — Weather Widgets look cool. And building one in ServiceNow? Even cooler 😎.
In this tutorial, we consume the WeatherAPI.com service using
sn_ws.RESTMessageV2() and render a clean UI in a Service Portal Widget.
Server Script
This script calls the API, fetches today’s weather, calculates a 3-day forecast, and returns it back to the widget.
(function () {

    try {
        var city = (options.city || "Hyderabad").replace(/ /g, "%20");
        var startDate = normalizeDate(options.start_date);

        var apiKey = gs.getProperty('weather.api.key');
        var url = "https://api.weatherapi.com/v1/forecast.json?key=" + apiKey +
                  "&q=" + city + "&days=3&aqi=no&alerts=no";

        var r = new sn_ws.RESTMessageV2();
        r.setEndpoint(url);
        r.setHttpMethod("GET");

        var result = JSON.parse(r.execute().getBody());

        var apiToday = result.forecast.forecastday[0].date;

        var displayToday = startDate || apiToday;
        var disp1 = computeNextDate(displayToday, 1);
        var disp2 = computeNextDate(displayToday, 2);

        data.weather = {
            city: result.location.name + ", " + result.location.country,
            temp: result.current.temp_c,
            icon_url: "https:" + result.current.condition.icon,
            date: formatPrettyDate(displayToday)
        };

        data.forecast = [
            {
                date: formatPrettyDate(disp1),
                avg_temp: result.forecast.forecastday[1].day.avgtemp_c,
                icon_url: "https:" + result.forecast.forecastday[1].day.condition.icon
            },
            {
                date: formatPrettyDate(disp2),
                avg_temp: result.forecast.forecastday[2].day.avgtemp_c,
                icon_url: "https:" + result.forecast.forecastday[2].day.condition.icon
            }
        ];

    } catch (ex) {
        data.error = ex.message;
    }

    function normalizeDate(inputDate) {
        if (!inputDate) return "";
        var gdt = new GlideDateTime();
        gdt.setDisplayValue(inputDate);
        return gdt.getLocalDate().toString();
    }

    function computeNextDate(dateStr, addDays) {
        var gdt = new GlideDateTime(dateStr + " 00:00:00");
        gdt.addDaysLocalTime(addDays);
        return gdt.getLocalDate().toString();
    }

    function formatPrettyDate(dateStr) {
        var p = dateStr.split("-");
        var monthIndex = parseInt(p[1], 10) - 1;
        var day = parseInt(p[2], 10);
        var months = ["Jan", "Feb", "Mar", "Apr", "May", "Jun",
                      "Jul", "Aug", "Sep", "Oct", "Nov", "Dec"];
        return months[monthIndex] + " " + day;
    }

})();
Client Controller
The client controller sends inputs (city, date) to the server and receives the forecast.
api.controller = function($scope) {
  var c = this;
};
Instance Options Schema
Below is the minimal instance option schema used for configuring the default city and start date in the Weather Widget.
            [
              {
                "name":"city",
                "section":"other",
              "label":"Default City",
              "type":"string"
              },
              {
                "hint":"DD-MM-YYYY",
                "name":"start_date",
                "section":"other",
                "label":"Start Date",
                "type":"string"
              }
            ]
Widget HTML
This is the UI that displays city name, temperature, and forecast.
<div class="weather-widget">
  <h3>{{data.weather.city}}</h3>
  <div class="forecast-card">
    <img ng-src="{{data.weather.icon_url}}">
    <div>{{data.weather.temp}}°C</div>
    <div>{{data.weather.date}}</div>
  </div>

  <div class="all-weather">
    <div class="forecast-card" ng-repeat="day in data.forecast">
      <img ng-src="{{day.icon_url}}">
      <div>{{day.avg_temp}}°C</div>
      <div>{{day.date}}</div>
    </div>
  </div>
</div>
The complete widget logic is already documented above, including the server script, client controller, instance options, and HTML structure. If you would like to download the full Widget XML file, use the button below.
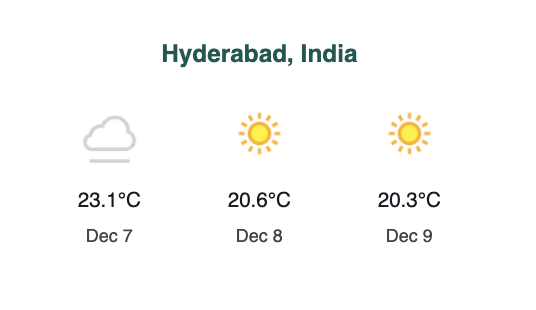
Final Output
This is how the weather widget appears in the Service Portal: